Note
Go to the end to download the full example code.
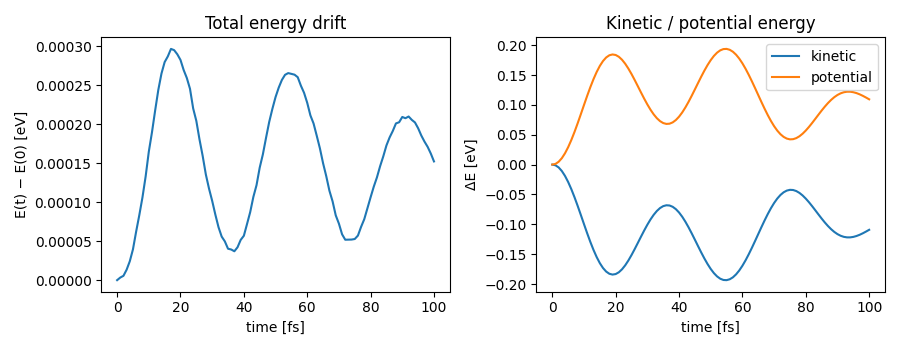
NVE molecular dynamics
Microcanonical (constant energy) molecular dynamics of bulk silicon using
ase.md.verlet.VelocityVerlet. Velocities are initialized from
a Maxwell–Boltzmann distribution at 300 K; total energy should stay flat
up to integration noise.
/home/runner/work/upet/upet/examples/1-ase-simulations/plot_md_nve.py:24: DeprecationWarning: Use thermalize_momenta
  MaxwellBoltzmannDistribution(atoms, temperature_K=300, rng=np.random.default_rng(0))
import matplotlib.pyplot as plt
import numpy as np
from ase import units
from ase.build import bulk
from ase.md.velocitydistribution import MaxwellBoltzmannDistribution
from ase.md.verlet import VelocityVerlet

from upet.calculator import UPETCalculator


atoms = bulk("Si", cubic=True, a=5.43, crystalstructure="diamond")
atoms.calc = UPETCalculator(model="pet-mad-xs", version="1.5.0", device="cpu")

MaxwellBoltzmannDistribution(atoms, temperature_K=300, rng=np.random.default_rng(0))

dyn = VelocityVerlet(atoms, timestep=1.0 * units.fs)

n_steps = 100
times, e_tot, e_kin, e_pot = [], [], [], []  # type: ignore


def log():
    times.append(len(times) * 1.0)  # fs
    ekin = atoms.get_kinetic_energy()
    epot = atoms.get_potential_energy()
    e_kin.append(ekin)
    e_pot.append(epot)
    e_tot.append(ekin + epot)


log()
for _ in range(n_steps):
    dyn.run(1)
    log()

times = np.asarray(times)
e_tot = np.asarray(e_tot)
e_kin = np.asarray(e_kin)
e_pot = np.asarray(e_pot)

fig, (ax_tot, ax_split) = plt.subplots(1, 2, figsize=(9, 3.5))
ax_tot.plot(times, e_tot - e_tot[0])
ax_tot.set_xlabel("time [fs]")
ax_tot.set_ylabel("E(t) − E(0) [eV]")
ax_tot.set_title("Total energy drift")

ax_split.plot(times, e_kin - e_kin[0], label="kinetic")
ax_split.plot(times, e_pot - e_pot[0], label="potential")
ax_split.set_xlabel("time [fs]")
ax_split.set_ylabel("ΔE [eV]")
ax_split.set_title("Kinetic / potential energy")
ax_split.legend()

fig.tight_layout()
plt.show()