Note
Go to the end to download the full example code.
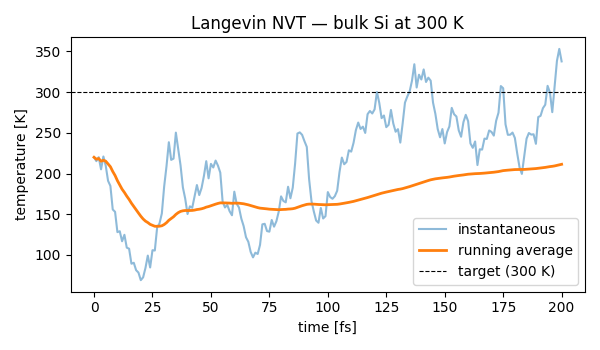
NVT molecular dynamics
Canonical (constant temperature) molecular dynamics of bulk silicon with
the ase.md.langevin.Langevin thermostat at 300 K. The
instantaneous temperature fluctuates around the target and its running
average converges there after a short equilibration.
/home/runner/work/upet/upet/examples/1-ase-simulations/plot_md_nvt.py:26: DeprecationWarning: Use thermalize_momenta
  MaxwellBoltzmannDistribution(
/home/runner/work/upet/upet/.tox/docs/lib/python3.13/site-packages/ase/md/langevin.py:102: FutureWarning: The implementation of `fixcm=True` in `Langevin` does not strictly sample the correct NVT distributions. The deviations are typically small for large systems but can be more pronounced for small systems. Use `fixcm=False` together with `ase.constraints.FixCom`. `fixcm` is deprecated since ASE 3.28.0 and will be removed in a future release.
  warnings.warn(msg, FutureWarning)
import matplotlib.pyplot as plt
import numpy as np
from ase import units
from ase.build import bulk
from ase.md.langevin import Langevin
from ase.md.velocitydistribution import MaxwellBoltzmannDistribution

from upet.calculator import UPETCalculator


T_TARGET = 300.0  # K

atoms = bulk("Si", cubic=True, a=5.43, crystalstructure="diamond")
atoms.calc = UPETCalculator(model="pet-mad-xs", version="1.5.0", device="cpu")

MaxwellBoltzmannDistribution(
    atoms, temperature_K=T_TARGET, rng=np.random.default_rng(0)
)

dyn = Langevin(
    atoms,
    timestep=1.0 * units.fs,
    temperature_K=T_TARGET,
    friction=0.01 / units.fs,
    rng=np.random.default_rng(1),
)

n_steps = 200
times, temperatures = [], []  # type: ignore


def log():
    times.append(len(times) * 1.0)
    temperatures.append(atoms.get_temperature())


log()
for _ in range(n_steps):
    dyn.run(1)
    log()

times = np.asarray(times)
temperatures = np.asarray(temperatures)
running_avg = np.cumsum(temperatures) / np.arange(1, len(temperatures) + 1)

fig, ax = plt.subplots(figsize=(6, 3.5))
ax.plot(times, temperatures, alpha=0.5, label="instantaneous")
ax.plot(times, running_avg, lw=2, label="running average")
ax.axhline(T_TARGET, color="k", ls="--", lw=0.8, label=f"target ({T_TARGET:.0f} K)")
ax.set_xlabel("time [fs]")
ax.set_ylabel("temperature [K]")
ax.set_title("Langevin NVT — bulk Si at 300 K")
ax.legend()

fig.tight_layout()
plt.show()