Note
Go to the end to download the full example code.
Basics: single-structure evaluation
Single-point evaluation of a bulk silicon cell with the smallest PET-MAD
model (pet-mad-xs). Two atoms are displaced off their equilibrium
positions so the predicted forces are non-trivial; we then attach a
UPETCalculator, read energy and forces via
the standard ASE API, and render the unit cell with the forces drawn as
arrows on top of the atoms.
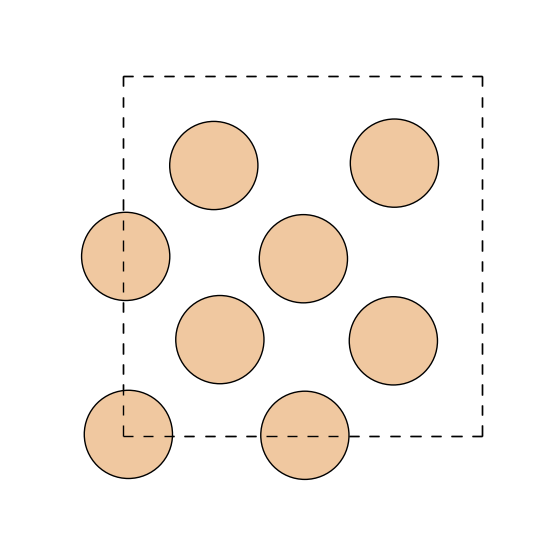
/home/runner/work/upet/upet/.tox/docs/lib/python3.13/site-packages/torch/jit/_script.py:1491: FutureWarning: `torch.jit.script` is deprecated. Please switch to `torch.compile` or `torch.export`.
  warnings.warn(
/home/runner/work/upet/upet/.tox/docs/lib/python3.13/site-packages/torch/jit/_script.py:1491: FutureWarning: `torch.jit.script` is deprecated. Please switch to `torch.compile` or `torch.export`.
  warnings.warn(
/home/runner/work/upet/upet/.tox/docs/lib/python3.13/site-packages/torch/jit/_script.py:1491: FutureWarning: `torch.jit.script` is deprecated. Please switch to `torch.compile` or `torch.export`.
  warnings.warn(
Number of atoms:        8
Total energy:           -46.8500 eV
Energy per atom:        -5.8562 eV
Max |force| component:  1.7096e+00 eV/Å
Stress (Voigt, eV/ų):  [-0.0079 -0.0047 -0.0059 -0.0008  0.0164  0.0048]
import matplotlib.pyplot as plt
import numpy as np
from ase.build import bulk
from ase.visualize.plot import plot_atoms

from upet.ase import UPETCalculator


atoms = bulk("Si", cubic=True, a=5.43, crystalstructure="diamond")

# perturb every atom by a small random displacement so the predicted
# forces on every site are non-zero and of comparable magnitude

atoms.rattle(0.05, seed=0)  # ASE's built-in random displacement method

calculator = UPETCalculator(model="pet-mad-xs", version="1.6.0", device="cpu")
atoms.calc = calculator

energy = atoms.get_potential_energy()
forces = atoms.get_forces()
stress = atoms.get_stress()

print(f"Number of atoms:        {len(atoms)}")
print(f"Total energy:           {energy:.4f} eV")
print(f"Energy per atom:        {energy / len(atoms):.4f} eV")
print(f"Max |force| component:  {np.abs(forces).max():.4e} eV/Å")
print(f"Stress (Voigt, eV/ų):  {np.array2string(stress, precision=4)}")

# Visualize the cell projected along z and overlay the in-plane force
# components as red arrows. A matplotlib quiver key acts as a scale bar.
fig, ax = plt.subplots(figsize=(5.5, 5.5))
plot_atoms(atoms, ax, radii=0.6, show_unit_cell=2)
plt.show()
Total running time of the script: (0 minutes 10.850 seconds)