Note
Go to the end to download the full example code.
Batched evaluation
This example evaluates energy, forces, and stress for several structures at
once, and plots the per-system results the batched pass returns. Each ASE
Atoms object is converted to an
AtomicData instance with
from_atoms(), and the resulting list is
collated into a single multi-graph Batch with
from_data_list(). A single forward pass through
UPETWrapper then evaluates all structures
together, which is substantially more efficient than looping over structures
one at a time (e.g. with the ASE calculator, see ASE).
Note
This example requires the optional nvalchemi extra:
pip install "upet[nvalchemi]".
import matplotlib.pyplot as plt
import numpy as np
import torch
from ase import units
from ase.build import bulk
from nvalchemi.data import AtomicData, Batch
from nvalchemi.neighbors import compute_neighbors

from upet.nvalchemi import UPETWrapper


device = torch.device("cuda" if torch.cuda.is_available() else "cpu")

model = UPETWrapper.from_checkpoint(model="pet-mad-xs", version="1.6.0", device=device)
Building a batch of different structures
Three diamond-structure crystals with different compositions and cell
sizes. Batch.from_data_list handles the ragged atom counts
transparently.
structures = {
    "Si": bulk("Si", cubic=True, a=5.43, crystalstructure="diamond"),
    "C": bulk("C", cubic=True, a=3.57, crystalstructure="diamond"),
    "Ge": bulk("Ge", cubic=True, a=5.66, crystalstructure="diamond"),
}
data_list = [
    AtomicData.from_atoms(atoms, device=device) for atoms in structures.values()
]
batch = Batch.from_data_list(data_list, device=device)
print(f"Batch: {batch.num_graphs} systems, {batch.num_nodes} atoms total")
Batch: 3 systems, 24 atoms total
Neighbor list and a single batched forward pass
Per-system results
outputs["energy"] has shape [num_graphs, 1]; forces are stacked
over all atoms in the batch, ordered the same way as data_list.
Si: E = -47.2384 eV
 C: E = -77.1805 eV
Ge: E = -40.3833 eV
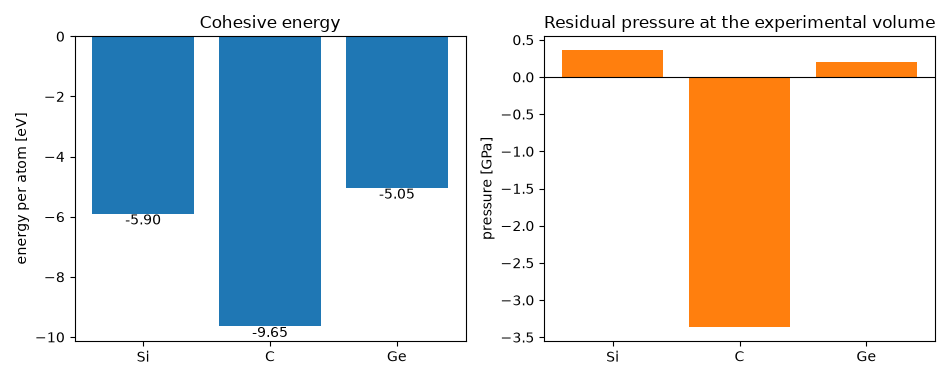
Comparing the systems
The point of the batched pass is that every per-system quantity comes
back already separated by graph, so the results can be compared
directly. num_nodes_per_graph gives the atom count needed to turn
total energies into energies per atom, and batch.cell gives the
volumes; the hydrostatic pressure is minus one third of the trace of
the Cauchy stress.
The three crystals sit at their experimental lattice constants rather
than at the model’s own minima, so the residual pressures are a measure
of how far each one is from the equilibrium volume pet-mad-xs
predicts.
names = list(structures)
n_atoms = batch.num_nodes_per_graph.cpu().numpy()
energy_per_atom = energies.numpy() / n_atoms

stress = outputs["stress"].detach().cpu()
pressure_gpa = (
    -torch.diagonal(stress, dim1=-2, dim2=-1).sum(-1).numpy() / 3.0 / units.GPa
)

fig, (ax_energy, ax_pressure) = plt.subplots(1, 2, figsize=(9.5, 3.8))
positions = np.arange(len(names))

ax_energy.bar(positions, energy_per_atom, color="tab:blue")
ax_energy.set_xticks(positions, names)
ax_energy.set_ylabel("energy per atom [eV]")
ax_energy.set_title("Cohesive energy")
for x, value in zip(positions, energy_per_atom, strict=True):
    ax_energy.text(x, value, f"{value:.2f}", ha="center", va="top")

ax_pressure.bar(positions, pressure_gpa, color="tab:orange")
ax_pressure.axhline(0.0, color="k", lw=0.8)
ax_pressure.set_xticks(positions, names)
ax_pressure.set_ylabel("pressure [GPa]")
ax_pressure.set_title("Residual pressure at the experimental volume")

fig.tight_layout()
plt.show()