Note
Go to the end to download the full example code.
NVT molecular dynamics
NVTLangevin samples the canonical ensemble
via a Langevin thermostat. This example runs it on a small water cluster
with UPETWrapper supplying conservative forces.
Unlike NVE, the total energy is not conserved here – the thermostat
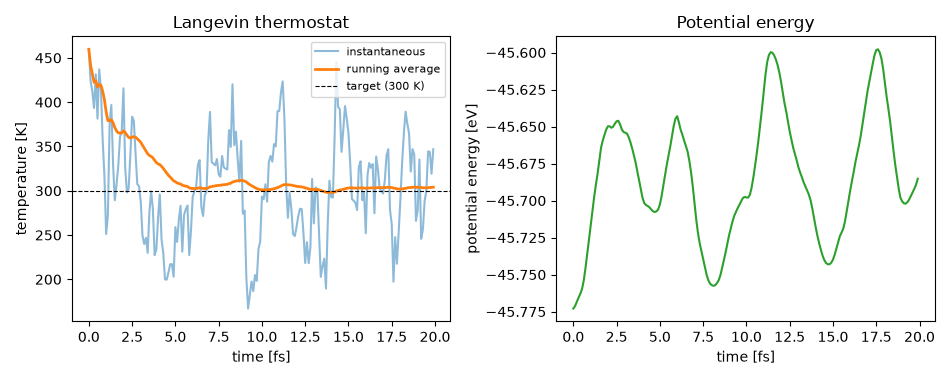
exchanges energy with a heat bath – so the diagnostic to plot is the
instantaneous temperature and its running average against the target.
Note
This example requires the optional nvalchemi extra:
pip install "upet[nvalchemi]".
from collections import defaultdict

import matplotlib.pyplot as plt
import numpy as np
import torch
from ase.build import molecule
from nvalchemi.data import AtomicData, Batch
from nvalchemi.dynamics import DynamicsStage, NVTLangevin, initialize_velocities
from nvalchemi.hooks import NeighborListHook, extract_dynamics_scalars
from nvalchemi.neighbors import compute_neighbors

from upet.nvalchemi import UPETWrapper


device = torch.device("cuda" if torch.cuda.is_available() else "cpu")
model = UPETWrapper.from_checkpoint(model="pet-mad-xs", version="1.6.0", device=device)

# Three water molecules spaced out into a loose cluster.
cluster = molecule("H2O")
for i in range(1, 3):
    shifted = molecule("H2O")
    shifted.translate([3.5 * i, 0.0, 0.0])
    cluster += shifted

data = AtomicData.from_atoms(cluster, device=device)

# The integrators write model outputs back into the batch fields that already
# exist and silently skip the ones that don't, while `AtomicData.from_atoms`
# only fills the fields the `Atoms` object itself carries -- so the output
# buffers have to be allocated up front.
data.energy = torch.zeros(1, 1, device=device)
data.forces = torch.zeros_like(data.positions)

batch = Batch.from_data_list([data], device=device)
compute_neighbors(batch, config=model.model_config.neighbor_config)
Recording the trajectory
nvalchemi runs the whole loop inside run(), so anything to be
plotted afterwards has to be collected while the loop is running. A
hook registered at AFTER_STEP
is the nvalchemi counterpart of ASE’s dyn.attach(logger, interval=1).
extract_dynamics_scalars() pulls the standard
observables (potential energy, max force norm, temperature) off the
batch, so the hook itself only has to accumulate them.
class TrajectoryRecorder:
    """Append the per-step scalar observables to a history dict."""

    def __init__(self):
        self.frequency = 1  # fire on every step
        self.stage = DynamicsStage.AFTER_STEP
        self.history: dict[str, list[float]] = defaultdict(list)

    def __call__(self, ctx, stage):
        self.history["step"].append(ctx.step_count)
        for key, value in extract_dynamics_scalars(ctx).items():
            self.history[key].append(value)


T_TARGET = 300.0  # K

temperature = torch.full((batch.num_graphs,), T_TARGET, device=device)
initialize_velocities(
    batch.velocities, batch.atomic_masses, temperature, batch.batch_idx.int()
)

# `NeighborListHook` rebuilds the neighbor list during the run, once an atom
# has moved further than the `skin` buffer.
TIMESTEP = 0.1  # fs

recorder = TrajectoryRecorder()
nvt = NVTLangevin(
    model=model,
    dt=TIMESTEP,
    temperature=T_TARGET,
    friction=0.5,
    n_steps=200,
    hooks=[
        NeighborListHook(
            model.model_config.neighbor_config,
            skin=0.5,
            stage=DynamicsStage.BEFORE_COMPUTE,
        ),
        recorder,
    ],
)

# The first integrator step already reads the forces, so the batch needs one
# model evaluation before the loop starts.
nvt.compute(batch)
batch = nvt.run(batch)

print(f"Ran {nvt.step_count} NVT steps")
print(f"Energy : {batch.energy.item():+.4f} eV")
Ran 200 NVT steps
Energy : -45.6853 eV
Thermostat behaviour
A nine-atom cluster is a small system, so the instantaneous temperature
fluctuates violently – the relative size of the fluctuations scales as
1/sqrt(N). The running average is the quantity that should approach
the target; the instantaneous trace is expected to swing widely around
it. The right panel shows the potential energy over the same window.
times = np.asarray(recorder.history["step"]) * TIMESTEP
temperatures = np.asarray(recorder.history["temperature"])
running_average = np.cumsum(temperatures) / np.arange(1, len(temperatures) + 1)

fig, (ax_temperature, ax_energy) = plt.subplots(1, 2, figsize=(9.5, 3.8))

ax_temperature.plot(times, temperatures, alpha=0.5, label="instantaneous")
ax_temperature.plot(times, running_average, lw=2, label="running average")
ax_temperature.axhline(
    T_TARGET, color="k", ls="--", lw=0.8, label=f"target ({T_TARGET:.0f} K)"
)
ax_temperature.set_xlabel("time [fs]")
ax_temperature.set_ylabel("temperature [K]")
ax_temperature.set_title("Langevin thermostat")
ax_temperature.legend(fontsize=8)

ax_energy.plot(times, recorder.history["energy"], color="tab:green")
ax_energy.set_xlabel("time [fs]")
ax_energy.set_ylabel("potential energy [eV]")
ax_energy.set_title("Potential energy")

fig.tight_layout()
plt.show()